2014
Data have been collected nationally from a total of 776 hospitals from both the public and private sectors. The average compliance rate was 80.3% .
Period One
National Data - National Hand Hygiene Initiative
Audit Period One 2014 - 1st November 2013 - 31st March 2014
Data have been collected nationally from a total of 776 hospitals from both the public and private sectors. The average compliance rate was 80.3% .
Overall Compliance Rate
| Correct Moments | Total Moments | Compliance Rate | Lower 95% CI | Upper 95% CI | |
|---|---|---|---|---|---|
| Overall Rate |
430,833 | 536,855 | 80.3% | 80.1% | 80.4% |
Number of data submissions by state
| State | Public | Private |
|---|---|---|
| ACT | 2 | 4 |
| NSW | 213 | 56 |
| NT | 5 | 0 |
| QLD | 92 | 53 |
| SA | 23 | 21 |
| TAS | 17 | 8 |
| VIC | 85 | 45 |
| WA | 66 | 30 |
| State Deidentified * | 56 | |
| Total | 503 | 273 |
*Some private hospital submitters chose to remain deidentified in the HHA database
Compliance Rate by Moment
| Moment | Correct Moments | Total Moments | Compliance Rate | Lower 95% CI | Upper 95% CI |
|---|---|---|---|---|---|
| 1 - Before Touching A Patient | 116,248 | 152,208 | 76.4% | 76.2% | 76.6% |
| 2 - Before Procedure | 40,828 | 49,497 | 82.5% | 82.1% | 82.8% |
| 3 - After a Procedure or Body Fluid Exposure Risk | 53,412 | 60,905 | 87.7% | 87.4% | 88.0% |
| 4 - After Touching a Patient | 131,782 | 154,302 | 85.4% | 85.2% | 85.6% |
| 5 - After Touching A Patient's Surroundings | 88,563 | 119,943 | 73.8% | 73.6% | 74.1% |
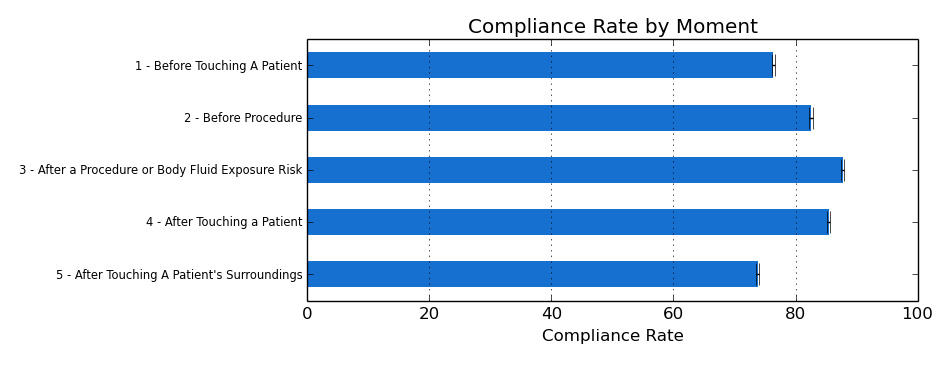 Figure 1. National Hand Hygiene Compliance Rate By Moment
Compliance Rate by Health Care Worker
| HCW Type | Correct Moments | Total Moments | Compliance Rate | Lower 95% CI | Lower 95% CI |
|---|---|---|---|---|---|
| Nurse/Midwife | 305,280 | 363,132 | 84.1% | 83.9% | 84.2% |
| Medical Practitioner | 51,018 | 75,105 | 67.9% | 67.6% | 68.3% |
| Personal Care Staff | 16,949 | 22,797 | 74.3% | 73.8% | 74.9% |
| Allied Health Care Worker | 21,455 | 27,290 | 78.6% | 78.1% | 79.1% |
| Administrative and Clerical Staff | 1,928 | 2,515 | 76.7% | 75% | 78.3% |
| Invasive Technician | 7,265 | 9,182 | 79.1% | 78.3% | 79.9% |
| Domestic | 9,666 | 14,341 | 67.4% | 66.6% | 68.2% |
| Student Doctor | 1,831 | 2,587 | 70.8% | 69% | 72.5% |
| Student Nurse/Midwife | 11,226 | 13,897 | 80.8% | 80.1% | 81.4% |
| Student Allied Health | 767 | 986 | 77.8% | 75.1% | 80.3% |
| Student Personal Care | 136 | 176 | 77.3% | 70.5% | 82.8% |
| Other - Not Categorised Elsewhere | 3,312 | 4,847 | 68.3% | 67% | 69.6% |
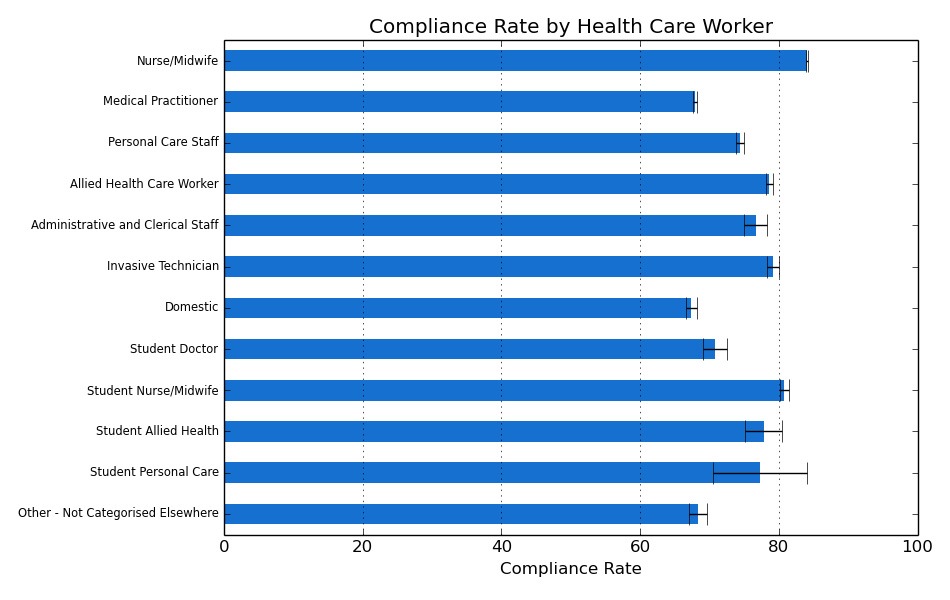
Figure 2. National Hand Hygiene Compliance Rates by Healthcare Profession
Figure 1 depicts the compliance rates for each of the 5 Moments. The highest rates of compliance were after completion of a procedure (87.7%) and after touching a patient (85.4%).
Figure 2 depicts the compliance rate by healthcare worker professional group. The highest compliance rates were nurses/midwives (84.1% for nurses/midwives and 80.8% for student nurses/midwives).
Medical Staff hand hygiene compliance rate by Moment
| Moment | Correct Moments | Total Moments | Compliance Rate | Lower 95% CI | Upper 95% CI |
|---|---|---|---|---|---|
| 1- Before Touching A Patient | 13,307 | 21,307 | 62.5% | 61.8% | 63.1% |
| 2 - Before Procedure | 4,387 | 5,934 | 73.9% | 72.8% | 75.0% |
| 3 - After a Procedure or Body Fluid Exposure Risk | 5,152 | 6,651 | 77.5% | 76.4% | 78.5% |
| 4 - After Touching a Patient | 17,757 | 23,379 | 76.0% | 75.4% | 76.5% |
| 5 - After Touching A Patient's Surroundings | 10,415 | 17,834 | 58.4% | 57.7% | 59.1% |
Nursing/Midwifery Staff hand hygiene compliance rate by Moment
| Moment | Correct Moments | Total Moments | Compliance Rate | Lower 95% CI | Upper 95% CI |
|---|---|---|---|---|---|
| 1 - Before Touching A Patient | 84,271 | 105,113 | 80.2% | 79.9% | 80.4% |
| 2 - Before Procedure | 31,849 | 37,696 | 84.5% | 84.1% | 84.9% |
| 3 - After a Procedure or Body Fluid Exposure Risk | 41,751 | 46,605 | 89.6% | 89.3% | 89.9% |
| 4 - After Touching a Patient | 92,728 | 105,139 | 88.2% | 88.0% | 88.4% |
| 5 - After Touching A Patient's Surroundings | 54,681 | 68,579 | 79.7% | 79.4% | 80.0% |
Compliance Rates By Ward Type
| Ward Type* | Correct Moments | Total Moments | Compliance Rate | Lower 95% CI | Upper 95% CI |
|---|---|---|---|---|---|
| Ambulatory Care | 16,317 | 20,338 | 80.2% | 79.7% | 80.8% |
| Critical Care Unit | 48,140 | 61,666 | 78.1% | 77.7% | 78.4% |
| Dental | 1,932 | 2,231 | 86.6% | 85.1% | 87.9% |
| Emergency Department | 19,993 | 27,436 | 72.9% | 72.3% | 73.4% |
| Maternity | 12,338 | 15,071 | 81.9% | 81.2% | 82.5% |
| Medical | 60,434 | 75,972 | 79.5% | 79.3% | 79.8% |
| Mental Health | 3,543 | 4,257 | 83.2% | 82.1% | 84.3% |
| Mixed | 35,336 | 43,379 | 81.5% | 81.1% | 81.8% |
| Neonatal Intensive Care Unit | 8,726 | 10,025 | 87.0% | 86.4% | 87.7% |
| Oncology/Haematology | 22,759 | 28,457 | 80.0% | 79.5% | 80.4% |
| Other | 59,017 | 72,553 | 81.3% | 81.1% | 81.6% |
| Paediatrics | 9,967 | 11,852 | 84.1% | 83.4% | 84.7% |
| Renal | 19,747 | 23,252 | 84.9% | 84.5% | 85.4% |
| Sub Acute | 15,531 | 18,745 | 82.9% | 82.3% | 83.4% |
| Surgical | 94,384 | 118,528 | 79.6% | 79.4% | 79.9% |
| Transplantation Unit | 2,669 | 3,093 | 86.3% | 85.0% | 87.5% |
Click here for ward type definitions.
Compliance Rates by Peer Group
Public hospitals only
| Public Peer Group** | Correct Moments | Total Moments | Compliance Rate | Lower 95% CI | Upper 95% CI |
|---|---|---|---|---|---|
| Principal (n= 82) | 217,186 | 274,095 | 79.2% | 79.1% | 79.4% |
| Large (n=39) | 44,347 | 53,612 | 82.7% | 82.4% | 83.0% |
| Medium (n=77) | 19,518 | 23,811 | 82.0% | 81.5% | 82.5% |
| Small (n=300) | 29,844 | 35,435 | 84.2% | 83.8% | 84.6% |
Please click here for public hospital peer group definitions These categories only apply to public hospitals. No Private Hospital data is included.
Private hospitals only
| Private Peer Group | Correct Moments | Total Moments | Compliance Rate | Lower 95%CI | Upper 95% CI |
|---|---|---|---|---|---|
| PPG 1 (n= 7) | 20,491 | 25,969 | 78.9% | 78.4% | 79.4% |
| PPG 2 (n= 5) | 11,910 | 14,699 | 81.0% | 80.4% | 81.7% |
| PPG 3 (n= 12) | 25,059 | 31,670 | 79.1% | 78.7% | 79.6% |
| PPG 4 (n= 19) | 15,400 | 19,480 | 79.1% | 78.5% | 79.6% |
| PPG 5 (n= 29) | 16,487 | 20,197 | 81.6% | 81.1% | 82.2% |
| PPG 6 (n= 64) | 11,749 | 14,531 | 80.9% | 80.2% | 81.5% |
| PPG 7 (n= 42) | 3,945 | 5,001 | 78.9% | 77.7% | 80.0% |
Click here for private hospital peer group definitions.
Private day hospitals only
| Day Hospital Peer Group | Correct Moments | Total Moments | Compliance Rate | Lower 95% CI | Upper 95% CI |
|---|---|---|---|---|---|
| Large (n= 19) | 4,710 | 5,972 | 78.9% | 77.8% | 79.9% |
| Medium (n= 24) | 4,675 | 5,464 | 85.6% | 84.6% | 86.5% |
| Small (n= 28) | 2,546 | 3,235 | 78.7% | 77.3% | 80.1% |
Click here for day hospital peer group definitions.
Standalone and Satellite Dialysis Centres only
| Dialysis Centres Peer Group | Correct Moments | Total Moments | Compliance Rate | Lower 95% CI | Upper 95% CI |
|---|---|---|---|---|---|
| Large (n= 8) | 601 | 751 | 80.0% | 77.0% | 82.7% |
| Small (n= 16) | 17,786 | 2,274 | 78.5% | 76.8% | 80.2% |
Click here for dialysis peer group definitions.
Period Two
National Data - National Hand Hygiene Initiative
Audit Period Two 2014 - 1st April - 30th June
Data have been collected nationally from a total of 782 hospitals from both the public and private sectors. The average compliance rate was 81% .
Overall Compliance Rate
| Correct Moments | Total Moments | Compliance Rate | Lower 95% CI | Upper 95% CI | |
|---|---|---|---|---|---|
| Overall Rate | 378,812 | 467,880 | 81% | 80.9% | 81.1% |
Number of data submissions by state
| State | Public | Private |
|---|---|---|
| ACT | 2 | 5 |
| NSW | 215 | 57 |
| NT | 5 | 2 |
| QLD | 89 | 53 |
| SA | 23 | 19 |
| TAS | 17 | 8 |
| VIC | 85 | 49 |
| WA | 69 | 34 |
| State Deidentified * | 50 | |
| Total | 505 | 277 |
*Some private hospital submitters chose to remain deidentified in the HHA database
Compliance Rate by Moment
| Moment | Correct Moments | Total Moments | Compliance Rate | Lower 95% CI | Upper 95% CI |
|---|---|---|---|---|---|
| 1 - Before Touching A Patient | 103,273 | 133,442 | 77.4% | 77.2% | 77.6% |
| 2 - Before Procedure | 35,743 | 43,018 | 83.1% | 82.7% | 83.4% |
| 3 - After a Procedure or Body Fluid Exposure Risk | 46,855 | 53,055 | 88.3% | 88% | 88.6% |
| 4 - After Touching a Patient | 115,806 | 135,238 | 85.6% | 85.4% | 85.8% |
| 5 - After Touching A Patient's Surroundings | 77,135 | 103,127 | 74.8% | 74.5% | 75.1% |
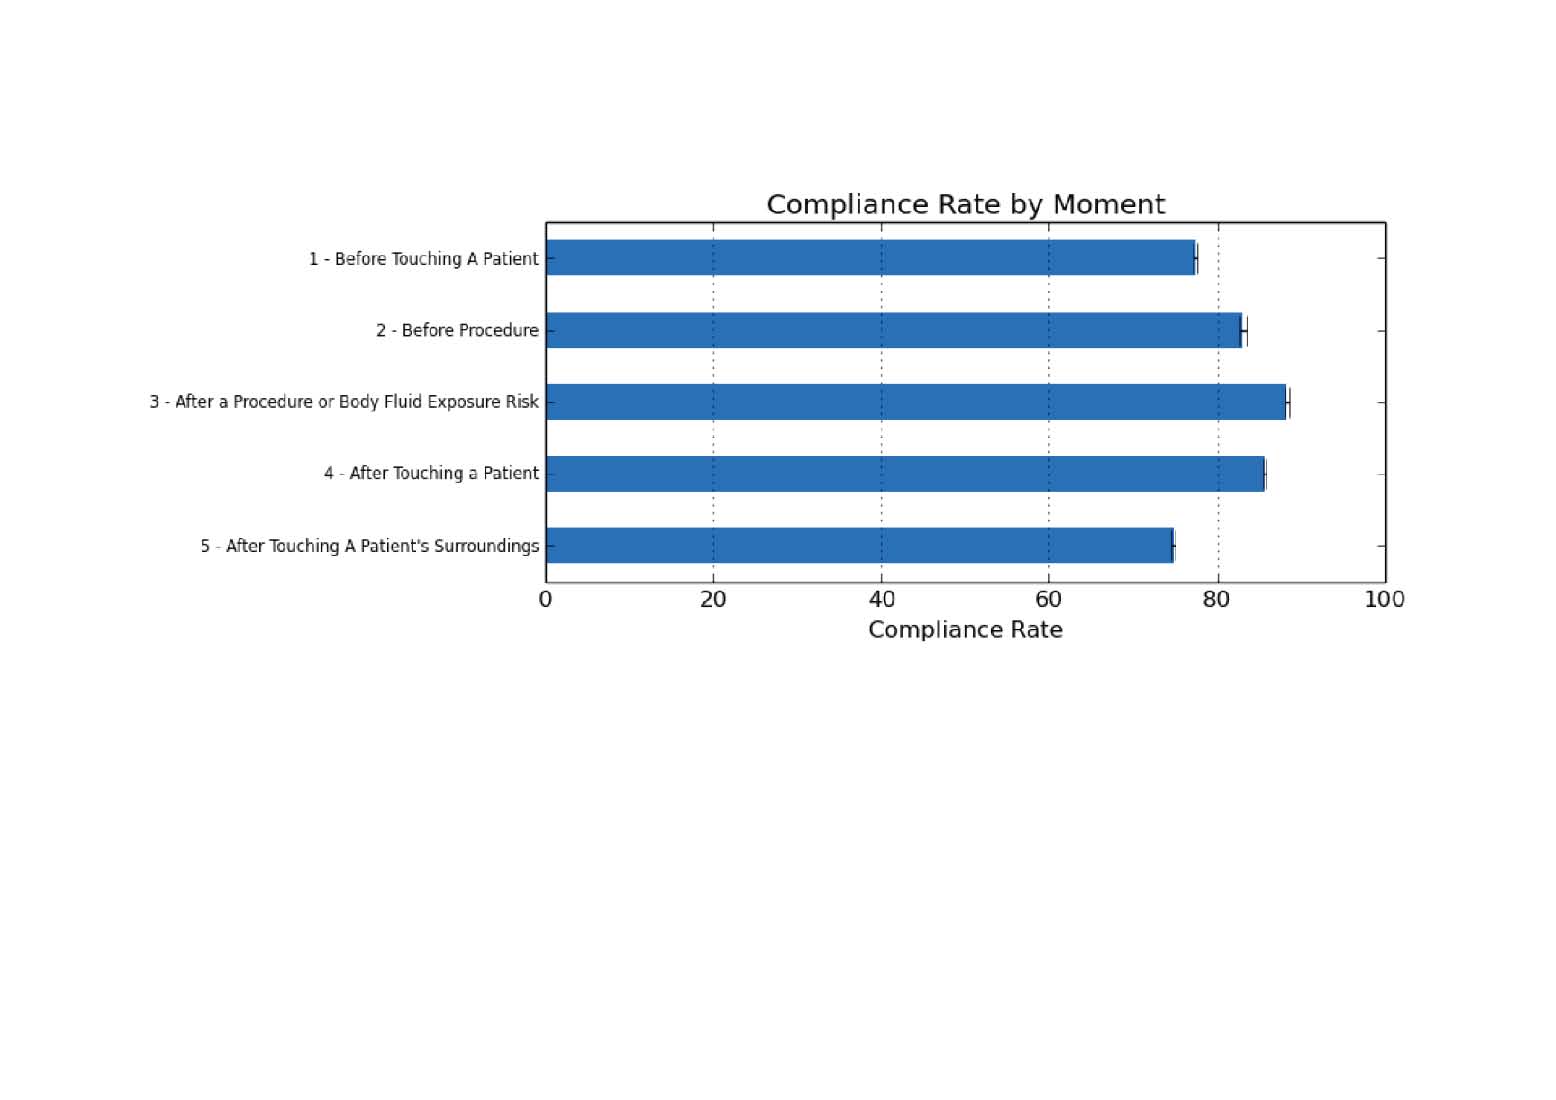
Figure 1. National Hand Hygiene Compliance Rate By Moment
Compliance Rate by Health Care Worker
| HCW Type | Correct Moments | Total Moments | Compliance Rate | Lower 95% CI | Lower 95% CI |
|---|---|---|---|---|---|
| Nurse/Midwife | 265,976 | 314,035 | 84.7% | 84.6% | 84.8% |
| Medical Practitioner | 44,314 | 64,300 | 68.9% | 68.6% | 69.3% |
| Personal Care Staff | 14,816 | 19,789 | 74.9% | 74.3% | 75.5% |
| Allied Health Care Worker | 17,946 | 22,461 | 79.9% | 79.4% | 80.4% |
| Administrative and Clerical Staff | 1,438 | 1,935 | 74.3% | 72.3% | 76.2% |
| Invasive Technician | 5,708 | 7,266 | 78.6% | 77.6% | 79.5% |
| Domestic | 8,265 | 11,970 | 69% | 68.2% | 69.9% |
| Student Doctor | 1,640 | 2,195 | 74.7% | 72.9% | 76.5% |
| Student Nurse/Midwife | 14,754 | 18,334 | 80.5% | 79.9% | 81% |
| Student Allied Health | 799 | 1,080 | 74% | 71.3% | 76.5% |
| Student Personal Care | 116 | 156 | 74.4% | 67% | 80.6% |
| Other - Not Categorised Elsewhere | 3,040 | 4,359 | 69.7% | 68.4% | 71.1% |
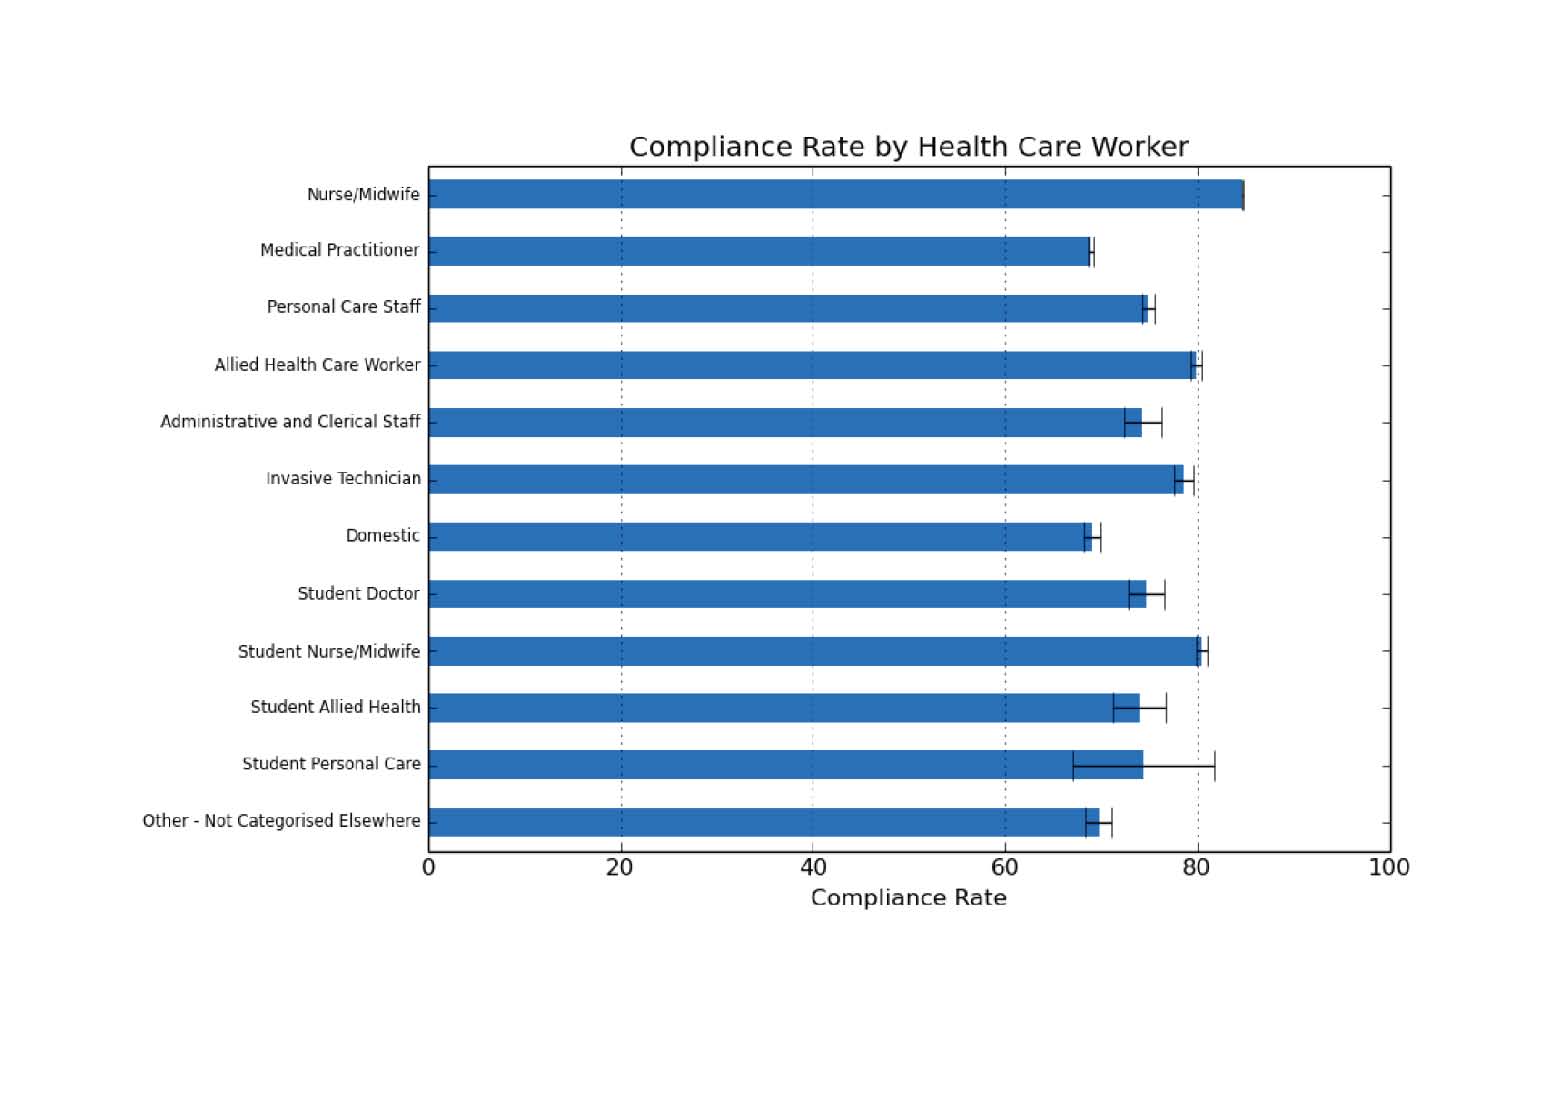
Figure 2. National Hand Hygiene Compliance Rates by Healthcare Profession
Figure 1 depicts the compliance rates for each of the 5 Moments. The highest rates of compliance were after completion of a procedure (88.3%) and after touching a patient (85.6%). Figure 2 depicts the compliance rate by healthcare worker professional group. The highest compliance rates were nurses/midwives (84.7% for nurses/midwives and 80.5% for student nurses/midwives).
Medical Staff hand hygiene compliance rate by Moment
| Moment | Correct Moments | Total Moments | Compliance Rate | Lower 95% CI | Upper 95% CI |
|---|---|---|---|---|---|
| 1- Before Touching A Patient | 11,875 | 18,430 | 64.4 % | 63.7% | 65.1% |
| 2 - Before Procedure | 3,944 | 5,266 | 74.9% | 73.7% | 76% |
| 3 - After a Procedure or Body Fluid Exposure Risk | 4,496 | 5,762 | 78% | 76.9% | 79.1% |
| 4 - After Touching a Patient | 15,129 | 19,778 | 76.5% | 75.9% | 77.1% |
| 5 - After Touching A Patient's Surroundings | 8,870 | 15,064 | 58.9% | 58.1% | 59.4% |
Nursing/Midwifery Staff hand hygiene compliance rate by Moment
| Moment | Correct Moments | Total Moments | Compliance Rate | Lower 95% CI | Upper 95% CI |
|---|---|---|---|---|---|
| 1 - Before Touching A Patient | 74,206 | 91,569 | 81% | 80.8% | 81.3% |
| 2 - Before Procedure | 27,513 | 32,290 | 85.2% | 84.8% | 85.6% |
| 3 - After a Procedure or Body Fluid Exposure Risk | 36,323 | 40,205 | 90.3% | 90.1% | 90.6% |
| 4 - After Touching a Patient | 80,788 | 91,468 | 88.3% | 88.1% | 88.5% |
| 5 - After Touching A Patient's Surroundings | 47,146 | 58,503 | 80.6% | 80.3% | 80.9% |
Compliance Rates By Ward Type
| Ward Type* | Correct Moments | Total Moments | Compliance Rate | Lower 95% CI | Upper 95% CI |
|---|---|---|---|---|---|
| Ambulatory Care | 13,104 | 16,288 | 80.5% | 79.8% | 81.1% |
| Critical Care Unit | 42,984 | 54,469 | 78.9% | 78.+6% | 79.3% |
| Dental | 2,204 | 2,485 | 88.7% | 87.4% | 89.9% |
| Emergency Department | 18,769 | 25,405 | 73.9% | 73.3% | 74.4% |
| Maternity | 11,880 | 14,101 | 84.2% | 83.6% | 84.8% |
| Medical | 53,943 | 66,975 | 80.5% | 80.2% | 80.8% |
| Mental Health | 3,710 | 4,655 | 79.7% | 78.5% | 80.8% |
| Mixed | 31,880 | 38,917 | 81.9% | 81.5% | 82.3% |
| Neonatal Intensive Care Unit | 7,810 | 9,097 | 85.9% | 85.1% | 86.6% |
| Oncology/Haematology | 20,120 | 24,719 | 81.4% | 80.9% | 81.9% |
| Other | 39,775 | 48,360 | 82.2% | 81.9% | 82.6% |
| Paediatrics | 10,613 | 12,450 | 85.2% | 84.6% | 85.9% |
| Renal | 18,701 | 21,965 | 85.1% | 84.7% | 85.6% |
| Sub Acute | 13,940 | 16,642 | 83.8% | 83.2% | 84.3% |
| Surgical | 87,601 | 109,197 | 80.2% | 80% | 80.5% |
| Transplantation Unit | 1,778 | 2,155 | 82.5% | 80.8% | 84.1% |
Click here for ward type definitions.
Compliance Rates by Peer Group
Public hospitals only
| Public Peer Group** | Correct Moments | Total Moments | Compliance Rate | Lower 95% CI | Upper 95% CI |
|---|---|---|---|---|---|
| Principal (n= 85) | 190,994 | 238,671 | 80% | 79.9% | 80.2% |
| Large (n=38) | 37,057 | 44,874 | 82.6% | 82.2% | 82.9% |
| Medium (n=77) | 17,761 | 21,415 | 82.9% | 82.4% | 83.4% |
| Small (n=299) | 26,820 | 31,389 | 85.4% | 85.1% | 85.8% |
Please click here for public hospital peer group definitions These categories only apply to public hospitals. No Private Hospital data is included.
Private hospitals only
| Private Peer Group | Correct Moments | Total Moments | Compliance Rate | Lower 95%CI | Upper 95% CI |
|---|---|---|---|---|---|
| PPG 1 (n= 6) | 16,352 | 20,163 | 81.1% | 80.6% | 81.6% |
| PPG 2 (n= 5) | 9,639 | 11,816 | 81.6% | 80.9% | 82.3% |
| PPG 3 (n= 12) | 20,806 | 26,297 | 79.1% | 78.6% | 79.6% |
| PPG 4 (n= 18) | 13,206 | 16,653 | 79.3% | 78.7% | 79.9% |
| PPG 5 (n= 27) | 15,001 | 18,125 | 82.8% | 82.2% | 83.3% |
| PPG 6 (n= 64) | 11,670 | 14,260 | 81.8% | 81.2% | 82.5% |
| PPG 7 (n= 47) | 4,435 | 5,594 | 79.3% | 78.2% | 80.3% |
Click here for private hospital peer group definitions.
Private day hospitals only
| Day Hospital Peer Group | Correct Moments | Total Moments | Compliance Rate | Lower 95% CI | Upper 95% CI |
|---|---|---|---|---|---|
| Large (n= 16) | 3,826 | 4,652 | 82.2% | 81.1% | 83.3% |
| Medium (n= 22) | 3,681 | 4,358 | 84.5% | 83.4% | 85.5% |
| Small (n= 29) | 2,755 | 3,427 | 80.4% | 79% | 81.7% |
Click here for day hospital peer group definitions.
Standalone and Satellite Dialysis Centres only
| Dialysis Centres Peer Group | Correct Moments | Total Moments | Compliance Rate | Lower 95% CI | Upper 95% CI |
|---|---|---|---|---|---|
| Large (n= 8) | 623 | 748 | 83.3% | 80.4% | 85.8% |
| Small (n= 15) | 2,039 | 2,545 | 80.1% | 78.5% | 81.6% |
Click here for dialysis peer group definitions.
Period Three
National Data - National Hand Hygiene Initiative
Audit Period Three 2014 - 1st July - 31st October
Data have been collected nationally from a total of 828 hospitals from both the public and private sectors. The average compliance rate was 81.9% .
Overall Compliance Rate
| Correct Moments | Total Moments | Compliance Rate | Lower 95% CI | Upper 95% CI | |
|---|---|---|---|---|---|
| Overall Rate |
439,856 | 537,154 | 81.9% | 81.8% | 82% |
Number of data submissions by state
| State | Public | Private |
|---|---|---|
| ACT | 2 | 5 |
| NSW | 223 | 84 |
| NT | 5 | 3 |
| QLD | 98 | 76 |
| SA | 23 | 20 |
| TAS | 17 | 8 |
| VIC | 86 | 63 |
| WA | 81 | 34 |
| Total | 535 | 293 |
Compliance Rate by Moment
| Moment | Correct Moments | Total Moments | Compliance Rate | Lower 95% CI | Upper 95% CI |
|---|---|---|---|---|---|
| 1 - Before Touching A Patient | 119,708 | 153,277 | 78.1% | 77.9% | 78.3% |
| 2 - Before Procedure | 43,217 | 50,925 | 84.9% | 84.6% | 85.2% |
| 3 - After a Procedure or Body Fluid Exposure Risk | 54,940 | 61,513 | 89.3% | 89.1% | 89.6% |
| 4 - After Touching a Patient | 133,336 | 154,069 | 86.5% | 86.4% | 86.7% |
| 5 - After Touching A Patient's Surroundings | 88,655 | 117,370 | 75.5% | 75.3% | 75.8% |
 Figure 1. National Hand Hygiene Compliance Rate By Moment
Compliance Rate by Health Care Worker
| HCW Type | Correct Moments | Total Moments | Compliance Rate | Lower 95% CI | Lower 95% CI |
|---|---|---|---|---|---|
| Nurse/Midwife | 303,576 | 355,059 | 85.5% | 85.4% | 85.6% |
| Medical Practitioner | 52,187 | 74,338 | 70.2% | 69.9% | 70.5% |
| Personal Care Staff | 18,055 | 23,725 | 76.1% | 75.6% | 76.6% |
| Allied Health Care Worker | 21,594 | 26,976 | 80.0% | 79.6% | 80.5% |
| Administrative and Clerical Staff | 1,800 | 2,378 | 75.7% | 73.9% | 77.4% |
| Invasive Technician | 7,239 | 8,771 | 82.5% | 81.7% | 83.3% |
| Domestic | 9,565 | 13,381 | 71.5% | 70.7% | 72.2% |
| Student Doctor | 1,820 | 2,420 | 75.2% | 73.4% | 76.9% |
| Student Nurse/Midwife | 18,838 | 22,998 | 81.9% | 81.4% | 82.4% |
| Student Allied Health | 1,216 | 1,592 | 76.4% | 74.2% | 78.4% |
| Student Personal Care | 210 | 256 | 82.0% | 76.9% | 86.2% |
| Other - Not Categorised Elsewhere | 3,756 | 5,260 | 71.4% | 70.2% | 72.6% |
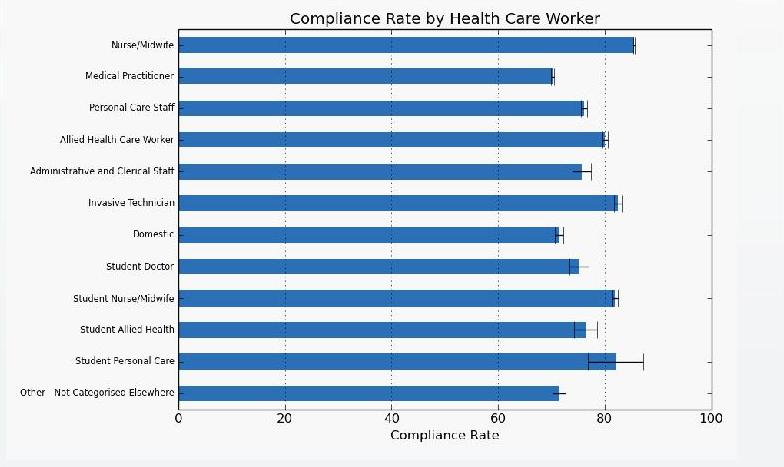
Figure 2. National Hand Hygiene Compliance Rates by Healthcare Profession
Figure 1 depicts the compliance rates for each of the 5 Moments. The highest rates of compliance were after completion of a procedure (89.3%) and after touching a patient (86.5%). Figure 2 depicts the compliance rate by healthcare worker professional group. The highest compliance rates were nurses/midwives (85.5% for nurses/midwives and 82.5% for Invasive Technicians).
Medical Staff hand hygiene compliance rate by Moment
| Moment | Correct Moments | Total Moments | Compliance Rate | Lower 95% CI | Upper 95% CI |
|---|---|---|---|---|---|
| 1- Before Touching A Patient | 13,793 | 21,188 | 65.1% | 64.5% | 65.7% |
| 2 - Before Procedure | 4,747 | 6,152 | 77.2% | 76.1% | 78.2% |
| 3 - After a Procedure or Body Fluid Exposure Risk | 5,285 | 6,735 | 78.5% | 77.5% | 79.4% |
| 4 - After Touching a Patient | 17,792 | 22,890 | 77.7% | 77.2% | 78.3% |
| 5 - After Touching A Patient's Surroundings | 10,570 | 17,373 | 60.8% | 60.1% | 61.6% |
Nursing/Midwifery Staff hand hygiene compliance rate by Moment
| Moment | Correct Moments | Total Moments | Compliance Rate | Lower 95% CI | Upper 95% CI |
|---|---|---|---|---|---|
| 1 - Before Touching A Patient | 84,563 | 103,349 | 81.8% | 81.6% | 82.1% |
| 2 - Before Procedure | 32,574 | 37,620 | 86.6% | 86.2% | 86.9% |
| 3 - After a Procedure or Body Fluid Exposure Risk | 41,523 | 45,490 | 91.3% | 91.0% | 91.5% |
| 4 - After Touching a Patient | 91,532 | 102,624 | 89.2% | 89.0% | 89.4% |
| 5 - After Touching A Patient's Surroundings | 53,384 | 65,976 | 80.9% | 80.6% | 81.2% |
Compliance Rates By Ward Type
| Ward Type* | Correct Moments | Total Moments | Compliance Rate | Lower 95% CI | Upper 95% CI |
|---|---|---|---|---|---|
| Ambulatory Care | 16,414 | 19,906 | 82.5% | 81.9% | 83.0% |
| Critical Care Unit | 49,074 | 61,462 | 79.8% | 79.5% | 80.2% |
| Dental | 3,879 | 4,275 | 90.7% | 89.8% | 91.6% |
| Emergency Department | 19,759 | 26,689 | 74.0% | 73.5% | 74.6% |
| Maternity | 14,978 | 18,063 | 82.9% | 82.4% | 83.5% |
| Medical | 63,341 | 78,326 | 80.9% | 80.6% | 81.1% |
| Mental Health | 5,682 | 6,889 | 82.5% | 81.6% | 83.4% |
| Mixed | 35,719 | 43,462 | 82.2% | 81.8% | 82.5% |
| Neonatal Intensive Care Unit | 10,123 | 11,497 | 88.0% | 87.4% | 88.6% |
| Oncology/Haematology | 23,771 | 28,533 | 83.3% | 82.9% | 83.7% |
| Other | 39,163 | 46,900 | 83.5% | 83.2% | 83.8% |
| Paediatrics | 12,293 | 14,441 | 85.1% | 84.5% | 85.7% |
| Renal | 22,541 | 25,757 | 87.5% | 87.1% | 87.9% |
| Sub Acute | 18,438 | 22,048 | 83.6% | 83.1% | 84.1% |
| Surgical | 102,872 | 126,682 | 81.2% | 81.0% | 81.4% |
| Transplantation Unit | 1,809 | 2,224 | 81.3% | 79.7% | 82.9% |
Click here for ward type definitions.
Compliance Rates by Peer Group
Public hospitals only
| Public Peer Group** | Correct Moments | Total Moments | Compliance Rate | Lower 95% CI | Upper 95% CI |
|---|---|---|---|---|---|
| Principal (n= 87) | 222,452 | 275,967 | 80.6% | 80.5% | 80.8% |
| Large (n=38) | 44,439 | 53,132 | 83.6% | 83.3% | 84.0% |
| Medium (n=77) | 20,403 | 24,542 | 83.1% | 82.7% | 83.6% |
| Small (n=309) | 30,751 | 35,603 | 86.4% | 86.0% | 86.7% |
Please click here for public hospital peer group definitions These categories only apply to public hospitals. No Private Hospital data is included.
Private hospitals only
| Private Peer Group | Correct Moments | Total Moments | Compliance Rate | Lower 95%CI | Upper 95% CI |
|---|---|---|---|---|---|
| PPG 1 (n= 6) | 19,162 | 23,474 | 81.6% | 81.1% | 82.1% |
| PPG 2 (n= 5) | 9,712 | 11,690 | 83.1% | 82.4% | 83.7% |
| PPG 3 (n= 12) | 24,483 | 30,424 | 80.5% | 80.0% | 80.9% |
| PPG 4 (n= 18) | 15,396 | 19,012 | 81.0% | 80.4% | 81.5% |
| PPG 5 (n= 27) | 15,735 | 18,509 | 85.0% | 84.5% | 85.5% |
| PPG 6 (n= 66) | 12,898 | 15,597 | 82.7% | 82.1% | 83.3% |
| PPG 7 (n= 50) | 5,230 | 6,334 | 82.6% | 81.6% | 83.5% |
Click here for private hospital peer group definitions.
Private day hospitals only
| Day Hospital Peer Group | Correct Moments | Total Moments | Compliance Rate | Lower 95% CI | Upper 95% CI |
|---|---|---|---|---|---|
| Large (n= 15) | 4,301 | 4,956 | 86.8% | 85.8% | 87.7% |
| Medium (n= 28) | 4,962 | 5,926 | 83.7% | 82.8% | 84.7% |
| Small (n= 32) | 2,713 | 3,207 | 84.6% | 83.3% | 85.8% |
Click here for day hospital peer group definitions.
Standalone and Satellite Dialysis Centres only
| Dialysis Centres Peer Group | Correct Moments | Total Moments | Compliance Rate | Lower 95% CI | Upper 95% CI |
|---|---|---|---|---|---|
| Large (n= 20) | 2,860 | 3,409 | 83.9% | 82.6% | 85.1% |
| Small (n= 6) | 541 | 648 | 83.5% | 80.4% | 86.1% |
Click here for dialysis peer group definitions.